Strength in Numbers #220
I have always been interested in how people attempt to predict fatigue in athletes and how fatigue contributes to mechanical overload, which can cause injury. I went through two doctoral competency exams to become educated as an exercise physiologist first, and then delved deeply into physics to become a biomechanist.
I had to fully appreciate the interrelationship between internal and functional responses to fatigue, and how such data points actually translate to biomechanical compensation (movement patterns that adapt to fatigue and can be injury-provoking) and altered neuromechanical capacity (changes in nerve conductance, muscle contraction coordination, and force).
I have taken blood out of pitchers, analyzed their spit for stress hormones, their force production, at one point gas exchange, EMG sensors over muscle bellies, 3D motions, heart rate variables, and urine – but nothing makes less sense in the sport of baseball than generalized approaches to tracking pitches and external load based on joint loading.
Early in my academic career, I was part of a group that studied commonly captured workloads in major league pitchers. We examined the conventional wisdom offered by well-known baseball analysts on television and Sports Illustrated baseball experts – such as the 100-pitch count limit and innings restrictions in MLB pitchers under the age of 25- and found nothing.
At one point, a statistic called Pitcher Abuse Points was introduced, allocating points to pitchers who threw over 100 pitches. This meant that the 101st pitch was considered more abusive than the 100th pitch, and that each pitch in succession beyond 100 added points. Things like this never fully materialized into the holy grail of predicting injuries, let alone fatigue, which is the leading cause of them.
In this article, you will gain insight into external workload tracking, its limitations, and what you can do to complete the picture. If you are tracking external load, meaning the number of pitches, throws, joint loads, etc., have no fear, your awakening is here.
My Curiosity in the Piggy-Back System
As I mentioned previously, in one of the first published articles on predictive metrics causing baseball injuries, we found that it didn’t matter what you did in the current or previous year; you still had a 27% chance of having surgery (ref).
This percentage has increased slightly today. Still, the funny thing is that pitchers are throwing less than ever, have more days of rest than ever, and are using their fastballs at an all-time low. This is called a paradox -basically a fancy word for indicating something is absolutely absurd.
In a second failed attempt to find anything meaningful in workload tracking, we evaluated innings, as they are generally used as a typical workload factor. Yet again, this yielded nothing in the way of restricted innings for young pitchers, in the hope that it would save their arms (ref). Innings are basically sets, and it’s the reps that count.
Where innings come into play is the determination of rates of load, such that pitches per inning, if kept low, make a player more efficient, as they can be in the game longer with less overuse. We call that Pitch Efficiency, and we go through mechanical elements and strength factors associated with throwing fewer pitches per inning in our Certified Biomechanics Course.
Dual vector co-contraction training is one method to improve the consistency of arm position at the release point, providing a safer way to load the arm with near-body-weight force without having to control a barbell overhead with one arm. Do not attempt this exercise without first progressing through our program to achieve overhead with ground reaction force stabilization through the shoulder joint. The course walks you through the levels.
This brings me to my next area of intrigue – the Piggy-Back System. If you have spent time in professional baseball, you have likely seen variations of this at some point, generally at lower levels, where two starters trade off in a game and a reliever is brought in. It’s a method to develop starting pitching and reduce overuse to pitchers’ arms by splitting the game into two innings and using a curtain closer for the show.
I studied this with the St. Louis Cardinals when I was with the team, was permitted to publish, and found something interesting – velocity escalated throughout the season. Still, at the time, I wasn’t through my PhD program entirely, but I quickly realized that velocity is not a great predictor of fatigue, as movement compensations likely occurred to ensure velocity was either heightened or maintained.
We also had a big old radar gun screen for the pitchers to enjoy during games and keep the octane high (ref). The interesting thing back in 2008 was that we did not use weighted balls, had great coaching and training, and on average, most pitchers increased their velocity by 4.4 mph from their first to last game of the season.
Years later, an important discovery was made by Jordan Oseguera, who was my Pitching Analyst with the Angels and is currently our Director of Pitching Performance, heading our sales.
Over the course of 7 years, he found that teams that had their pitchers throw fewer pitches at lower levels ended up having many more injuries once players reached full-season leagues. That made me think the opposite of today’s standards of overuse, where the problem is actually underloading the throwing arm.
We were looking at cumulative workload the wrong way – restricting pitch counts appeared actually to be way more harmful.
External Workload Tracking in Baseball Today
So, given you have read a little history into the quest for the holy grail and coming up with nothing, how are injuries going up while our athletes are throwing less than ever, have more rest, and never usually get anywhere near 100 pitches as they are taken out early to reduce the amount of times the batting order faces them?
Injuries are going up, pitches thrown going down, days’ rest going up, and fewer fastballs thrown than ever in the history of sport, and we are still talking about workload? There’s not enough of it, and when it is assigned, it’s like magic, some kind of crystal mathematical ball that no one fact-checks.
I have nothing against the use of external workload tracking; I think it qualifies what you can do in a practice or game setting, but if you do not have the understanding of function, you truly would have no idea how to individualize, unless you are testing the functional strength metrics before and after pitching.
This can be accomplished in various ways. Still, our platform is the best in the world at understanding a functional response to workload, and all other measures, predictions, or projections of how an athlete will experience a current or future workload response without our platform are called a guestimate – more guess than estimate. Not an assessment.
There are numerous throwing programs in existence. There’s not one clear way to progress the throwing arm, but there is one clear way on why it gets hurt. Exponential volume loading that does not involve functional strength measurement is a disaster.
This type of throwing programming is strangely the basis of return to throwing programs after surgeries, and we wonder why revision surgeries are increasing – we are focused on FREQUENCY, FORCE ESTIMATION over FUNCTION.
If you don’t know your arm’s strength capacity, it doesn’t matter how little, how much, or how many accelerations it can handle on a given day.
What is the Acute to Chronic Workload Ratio?
The Acute-to-Chronic Workload concept—as popularly used today in sports and injury risk monitoring—was introduced by Tim Gabbett and colleagues. When I was with the Angels, we had Tim come in as a speaker. He was new to baseball and was looking to adapt his model from running-based sports, which focused on hamstring strains, to throwing-based sports, where he saw potential in baseball.
Gabbett’s model builds on earlier fitness-fatigue models (e.g., Banister and Calvert) by framing short-term (“acute”) load relative to longer-term (“chronic”) load, but it has been met with skepticism. His goal: maintain an athlete’s acute workload within a safe window, relative to what their body is conditioned for, thereby reducing injury risk while optimizing performance.
The Acute to Chronic Workload Ratio (ACWR) is one of the most widely used models in sports science for monitoring athlete health and performance. At its core, it compares an athlete’s short-term workload (acute) — often defined as a 1-week rolling average — to their long-term workload (chronic) — typically a 4-week rolling average. We stumped Tim because the way the ACWR is calculated, it didn’t mathematically convert well to a 5-day schedule, as two days are eliminated from the 7-day/28-day equation.
- ACWR = Acute Workload ÷ Chronic Workload
- A ratio above 1.5 is thought to indicate higher injury risk (too much stress too quickly, according to sports such as soccer and rugby).
- A ratio below 0.8 suggests undertraining and a loss of readiness, which is more prevalent in baseball.
- A ratio between 0.8–1.3 is often labeled the “sweet spot”, but on any given day, you have no idea what the functional condition of the athlete is like or how they respond to the “sweet spot”, which could be “sour spot” for some.
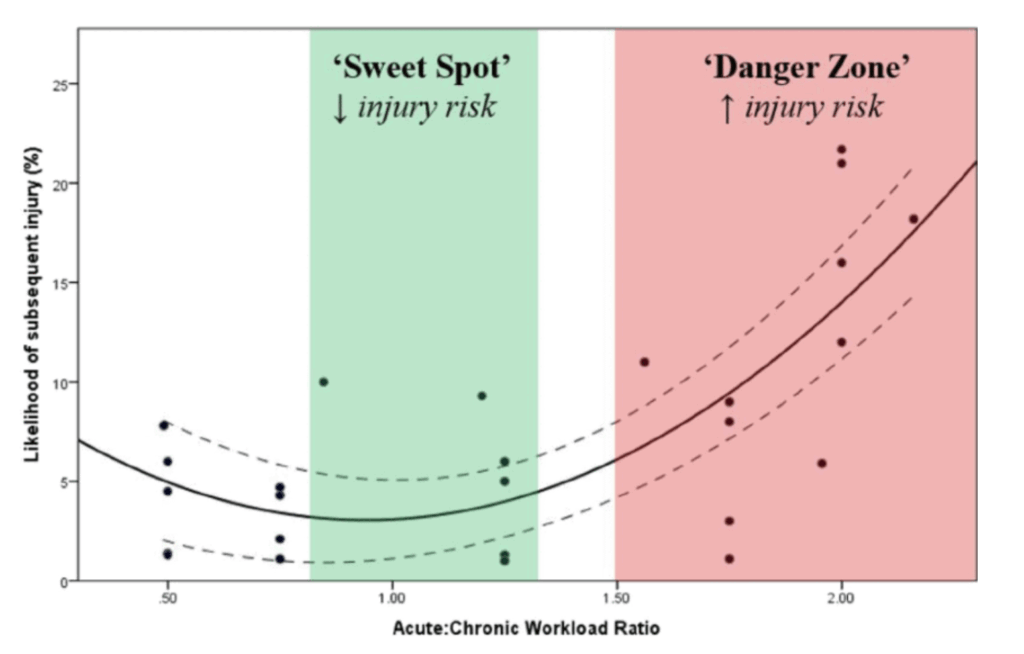
This image gained fame since its inception around 2015. Ten years later, this approach is still widely accepted in baseball as the gold standard for workload monitoring. However, what is missing from making this estimation individualized is the functional responses to each of the ACWR.
Note the dots on the graph – you can see some subjects with a higher injury likelihood in the sweet spot and some with lower risk of injury in the danger zone.
It’s 100% happening that players are getting hurt in the sweet spot, because they may functionally not be responding well to the sweet spot loading progression on the given day, or afterwards. There’s no objective measure of recovery in this model either.
In baseball, workloads can be calculated with:
- Pitch counts (mentioned in previous research, there’s no predictive merit for pros)
- Total innings pitched (previous research had no predictive merit for pros)
- Bullpen throws + game throws combined (more possible as a load factor)
- Session duration
- RPE x duration (subjective intensity x volume) (accounts for players’ feelings)
- Wearable technology (arm speed sensors, workload meters, radar-based throwing counts, and proxies of throwing arm joint loads – more objectively quantified for physiological effort and may detect compensation, but it is after the fact)
Flaws in Applying ACWR to Pitching
While ACWR has value in the field and running sports, its application to baseball — especially pitching — is problematic.
- Pitching Schedule Variability
- Starters on a 5-day rotation accumulate acute workloads differently than those on a 6- or 7-day schedule.
- ACWR doesn’t account for these built-in recovery differences. A pitcher’s ratio may appear “safe” while hidden fatigue builds.
- No Functional Feedback
- ACWR is external load only — it tells us what the athlete did, not how they responded.
- A pitcher throwing 90 pitches may experience vastly different recovery demands depending on arm strength, mechanical efficiency, and fatigue history.
- Hidden Accumulation of Fatigue
- The model assumes adaptation follows a neat linear pattern. But pitching stress is not linear — it’s high intensity, unilateral, and elastic.
- Microtrauma can compound even when ratios appear to be within range, and compensations create overload vulnerability. The magnitude of loading may be similar, but the speed of loading could change and become more problematic.
Supercompensation and the Problem of Prediction
The supercompensation model is the foundation of all training theory. It describes how the body responds to stress:
- Training stress → fatigue + microtrauma
- Recovery phase → tissue repair + strength regain
- Supercompensation → body adapts to exceed previous capacity
But here’s the issue:
- If the workload is too high, supercompensation never occurs — the athlete slips into overtraining and an increased risk of injury.
- If the workload is too low, the athlete may detrain, losing strength and velocity, and risk injury as well.
- ACWR cannot determine which outcome is happening because it lacks functional markers of recovery and response to the assigned workload.
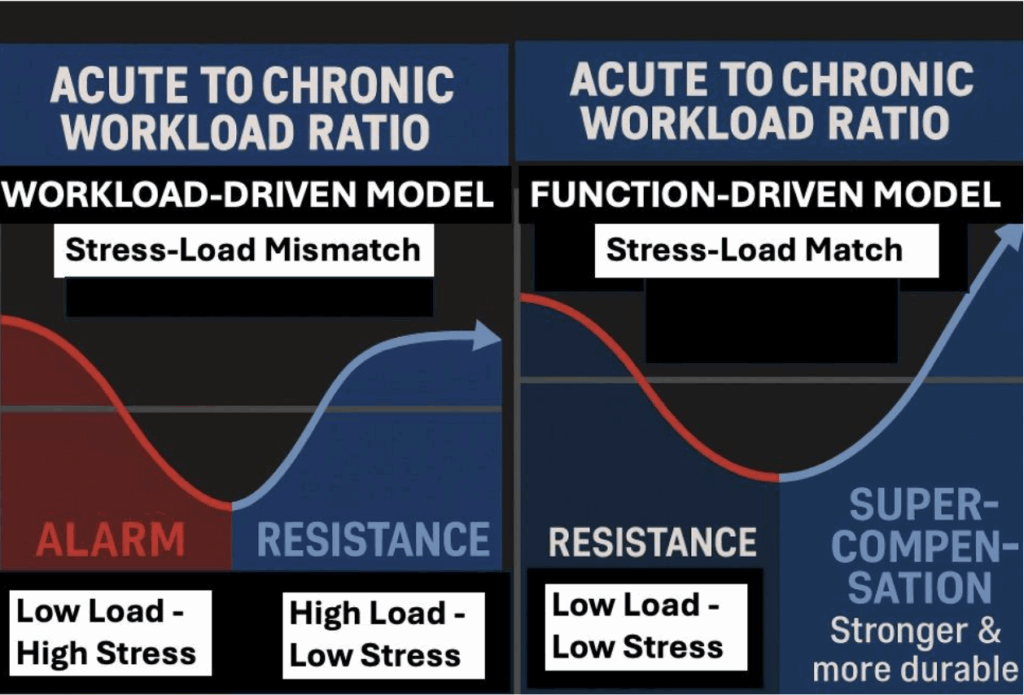
Here’s a quick schematic to indicate the need for functional testing in workload monitoring and planning. On the left, the model uses the previous workload to assign the new workload. There are numerous cases where low-load, high-stress days can occur.
For example, if a player has a beloved dog die the day before a lighter training day (let’s say an ACWR of 0.8), sleeps for two hours, and then throws – there’s a significant capacity change that puts the athlete into alarm.
Another athlete may be considered in a high-load training cycle (1.1-1.3), only to find that their resistance, meaning capacity, is so high that they are actually being undertrained, and the stress is too low for the throwing arm to build capacity. On the right, it includes function-strength testing as a modifier of workload.
Here, athletes build resistance by understanding what low load and low stress actually mean – an athlete showing maximal strength going into the training day and showing minimal fatigue coming out of it.
By understanding the load-stress match through strength testing before and after throwing sessions, coaches can truly comprehend the concept of downloading, de-loading, reloading, and overloading the program, which leads to supercompensation.
Toward a Better Solution: Functional Workload Testing
The missing piece in workload management is functional response. Instead of relying solely on pitch counts or throwing program session logs, we must know:
- Throwing Arm Strength and ArmScore (lbs of force + strength-to-body weight)
- Shoulder Balance (ER/IR ratio)
- Strength-Velocity Ratio (lbs per MPH)
- Strength Recovery (+/- lbs from previous tests)
- Strength Fatigue (% of Fresh Strength from the Previous Session)
- Range of motion changes
By integrating these checkpoints, workloads can be scaled in real-time:
- Download: Slight volume/intensity reduction
- Deload: Significant reduction in both
- Reload: Gradual ramp-up in volume/intensity
- Overload: Intentional spike for adaptation around de-loading cycles
With functional testing leading the way, the workload assignment is better individualized, and throwing programs will be even more streamlined to quantify how pitchers fatigue, recover, adapt, and supercompensate, thereby optimizing workload to prevent under- and overtraining.
The complete workload management picture emerges from a comprehensive workload monitoring approach that integrates function, feel, and form – thereby allowing you to understand contractile responses, cognitive subjective ratings of fatigue, and changes in force loading on the throwing arm.
These aspects are not only paramount for preventing injuries, but the attention to detail is even higher when working with athletes throughout their return to throwing programs. We have nuggets like this and so much more in our Certified ArmCare Specialist Course.
Key Takeaways
ACWR offers a basic external load snapshot but fails to capture how the arm is actually responding. Pitchers’ unique schedules (5/6/7-day rotations) make ratio-based cutoffs misleading, and derivations of external load-based quantified intensity metrics may not directly align with changes in functional outcomes.
Proper injury prevention comes from measuring function, not just volume. Integrating strength testing, ROM analysis, and fatigue tracking alongside external workloads creates the most complete picture of health and readiness.
A player-informed, data-led process is the future of workload management — where every pitcher’s program is scaled by how their arm feels, functions, fatigues, and recovers force.
The offseason is around the corner – have you planned out your throwing programs?
Strength Matters Most,
Ryan