Strength in Numbers #235
The force–velocity curve describes a fundamental property of muscle contraction: as contraction speed increases, the maximum force a muscle can produce decreases.
At slow speeds (or during isometric efforts), muscle fibers have more time to form cross-bridges, resulting in higher force output.
At very fast speeds, fewer cross-bridges can attach, so force capacity drops.
A classic weight room example is the comparison between a deadlift and a power clean.
A heavy deadlift sits on the high-force, low-velocity end of the curve—you’re moving a heavy load slowly, producing maximal force.
A power clean is further to the right on the curve—a lighter load moved at a much higher speed.
Pitching occurs at the extreme high-speed end of this same curve. However, that doesn’t mean force production is irrelevant.
That’s because by increasing maximum strength, you raise the entire curve.
Why This Matters for the Arm
When max strength improves:
- Submaximal throwing efforts become less taxing
- Neurological demand during pitching decreases
- Fatigue resistance improves
This helps explain why pitchers with greater rotational strength and balance often throw harder with less visible strain.
Emerging research supports this relationship, showing that increasing throwing-arm maximum force by approximately 7 lbs is associated with a ~1.4 mph increase in velocity.
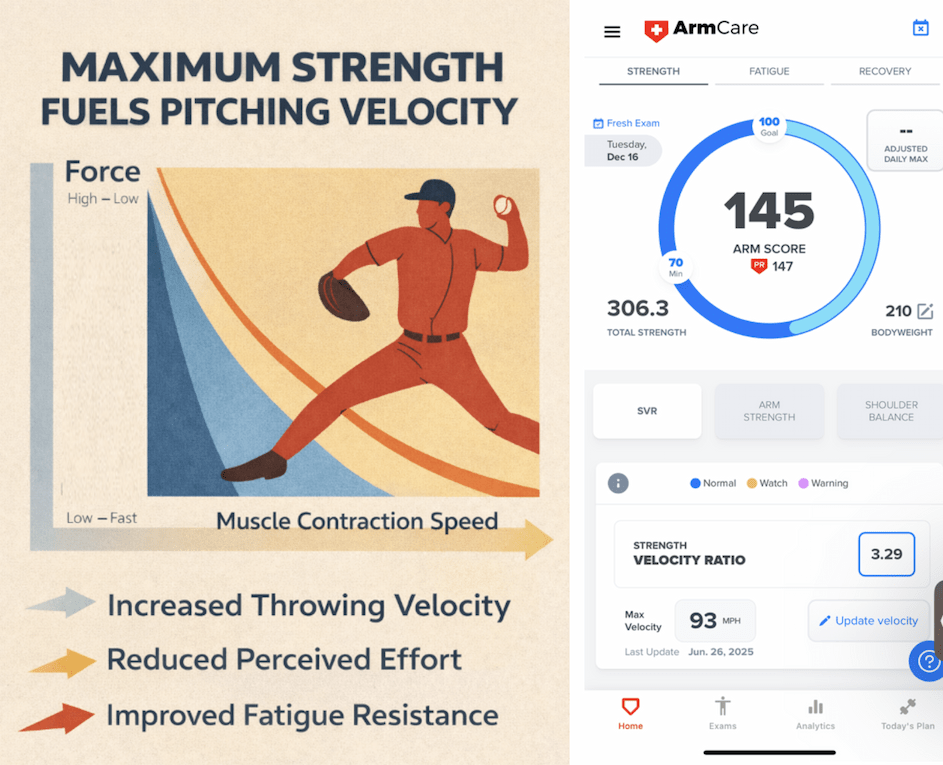
In the app image, this athlete demonstrates 3.29 lbs of force per mph of throwing velocity. For reference, our benchmark is ≥1.6 lbs/mph.
Staying above that threshold indicates sufficient force capacity to support higher velocities while placing less stress on the arm.
The bottom line: build strength first!
When strength leads, velocity becomes a safer and more sustainable
Strength matters most!