Coaching pitchers in today’s game may look like we are focused on developing throwers rather than pitchers.
Velocity enhancement programming (Velo Programs) has become more popular than ever. With the introduction of weighted balls, scouts have more hard-throwing pitchers to evaluate, and all 30 MLB teams are concerned with finding the hardest-throwing pitchers in the draft.
What is crazy is that high school prospects today are throwing at higher velocities than MLB players only a few decades ago. As pitchers continue to light up the radar gun, we must ask the question, does throwing harder increase your chances of becoming a Major League pitcher?
What you might find ironic is that our answer is “maybe.”
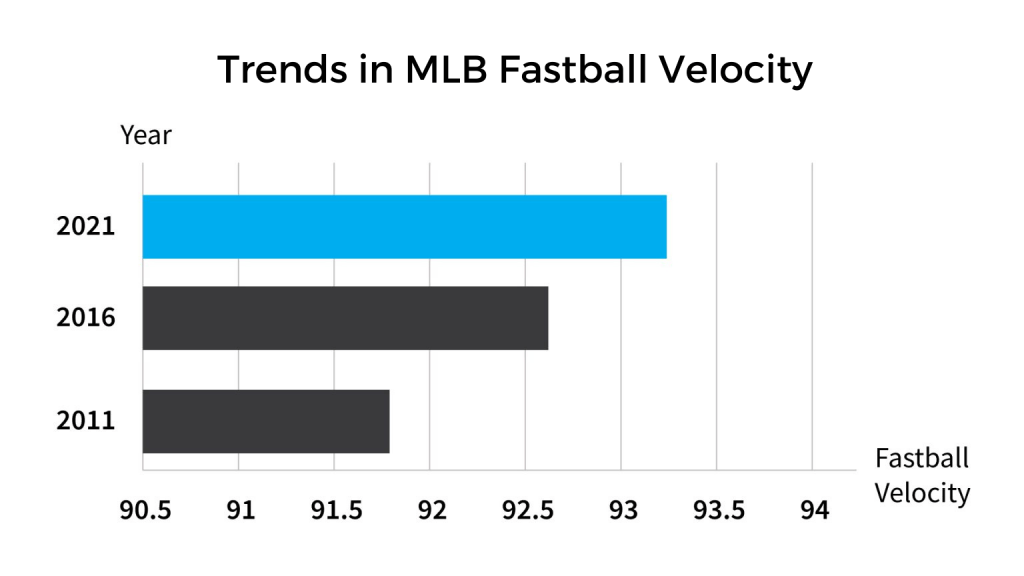
In today’s game, hitters have less than 400 milliseconds (0.4 seconds) to hit a 90 mph fastball, and that time window is getting shorter. In 2021, the average Major League fastball increased 2 mph from 2011, going from 91.5mph to 93.5 mph, yet that still does not tell us if harder-throwing pro’s are better in competition.
To evaluate the predictive strength of fastball velocity on pitching performance, an international group of researchers evaluated pitching determinants of FIP (fielding independent pitching). FIP is a measurement that encapsulates everything in a pitcher’s control, including strikeouts, unintentional walks, hit-by-pitches, and homeruns.
These measures are scaled and referenced per inning. A lower FIP indicates a better pitcher. FIP is predicted better when including various control and ball velocity measures, not just fastball velocity alone. This mix of pitch location, velocity, and variability in both location and velocity could explain 24% of the variance in FIP.3
When isolating only fastball velocity, approximately 10% of FIP could be explained.3 This means that 90% of an improvement in FIP occurs by other factors outside velocity (such as the ability to mix pitches, deception, ball movement, etc.) This is the first analysis to reveal that velocity alone does not guarantee elite-level performance.
We looked more into All-Time FIP leaders and found that the top 25 had black-and-white photos from the earlier days of the sport.
Compared to the current trend, it is safe to say that these individuals did not throw nearly as hard as today’s performers and were smaller in stature.2 It is possible that they could have faced less skilled competition and had larger strike zones. Interestingly, the only modern-day player to crack the top 50 in FIP is Jacob deGrom. Even Nolan Ryan, one of the most acclaimed hard-throwing pitchers in the history of the sport, did not crack the top 100 (Nolan Ryan was 125th).
Here is the gallery of the career leaders in FIP…probably no one you would recognize.

To further our investigation, we studied Statcast data on starting pitchers from 2015-2019 to evaluate the connection between fastball velocity and pitching performance. Our data table is below:
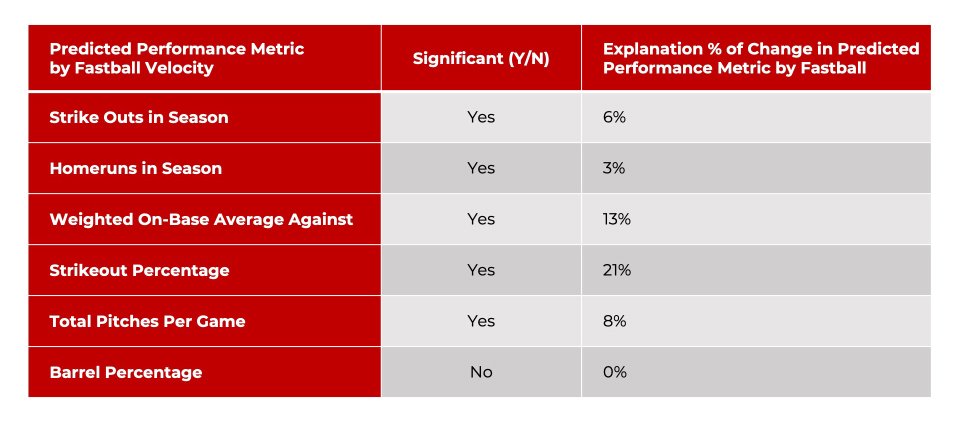
Overall, the effect of fastball velocity was not as great as we had thought in an MLB population. Only the strikeout percentage reached a level of explained variance over 20%. For all factors above, more than 79% of the changes in the predicted measures were happening outside of fastball velocity.
This means that increasing strikeouts in a season, homeruns in a season, weighted on-base average against the pitcher, strike-out percentage, and total pitches per game were minimally related to an increase in fastball velocity.
What was most interesting was the evaluation of barrel percentage. Barrel percentage refers to the rate of hits between 26-30 degrees of launch angle off the bat that was struck at exit velocities at 98mph or higher off a pitcher. Typically, these batted ball characteristics have an average of over .500 and a slugging percentage of 1.500 or more. Fastball velocity had no relation to either increasing or decreasing the barrel percentage rate. This means that hitters have the same contact consequences regardless of one’s fastball velocity. In other words, just because you throw excessively hard, that does not mean that your pitches will be barreled less.
Let’s take a look at the change-up in relation to the fastball. It’s thrown significantly slower and has less shoulder and elbow loading by comparison.1 In this analysis, we performed comparative testing between both pitches in relation to average weighted on-base average (wOBA) for hitters, exit velocities off the bat and distance that the ball travels. A table of significant results can be seen below:
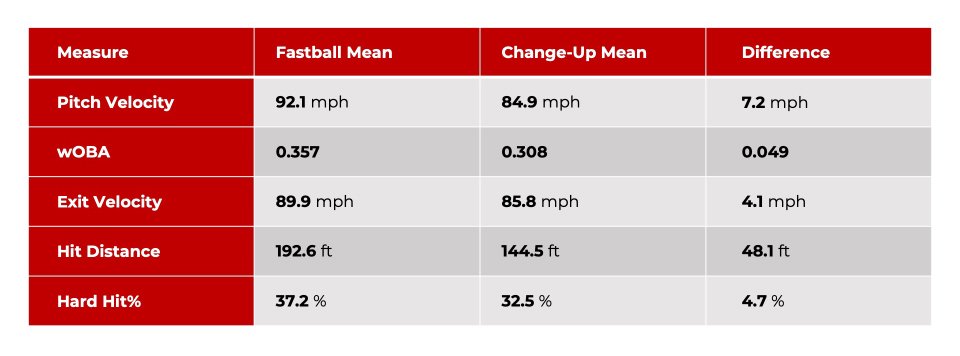
Our results show that the change up reduces wOBA by almost 50 points. Balls come off the bat approximately 4 mph slower, and the ball travels nearly 50 feet less than the average fastball pitched. The average difference in velocity between the pitches was around 7 mph and approximately a 5% decrease in hard hit% was seen for change-up pitches.
In summary, our research on elite-level performers indicates that although velocity increases your chances of securing a collegiate scholarship or being drafted by an MLB team, there is more to the story in becoming one of the game’s best. In player development, we cannot lose sight of pitchability.
By pitchability I mean being able to throw any pitch in any count and incorporate the change-up into an athlete’s development plan. A good change-up increases pitchers’ deception and disrupts hitters’ timing. Most importantly, the ability to throw a change-up can reduce the amount of wear and tear on the throwing arm.
Just some food for thought the next time you pick up a weighted ball and go for a run-and-gun.
References
- Fleisig GS, Kingsley DS, Loftice JW, et al. Kinetic comparison among the fastball, curveball, change-up, and slider in collegiate baseball pitchers. Am J Sports Med. 2006;34(3):423-430.
- Forsythe CM, Crotin RL, Greenwood M, Bhan S, Karakolis T. Examining the influence of physical size among major league pitchers. J Sports Med Phys Fitness. 2017;57(5). doi:10.23736/S0022-4707.16.06355-6
- Whiteside D, Martini DN, Zernicke RF, Goulet GC. Ball speed and release consistency predict Pitching success in major league baseball. J strength Cond Res. 2016;30(7):1787-1795.