Strength in Numbers #155
It’s about 2 pm, and I am in my office, getting an email that turned my stomach. A dedicated father with a serious pedigree in baseball and two talented sons reached out to me as his 10-year-old had what he believed was an extreme case of Little Leaguer’s elbow.
I had mentioned to him that I needed to know the exact medical diagnosis before I could accurately advise him. To my astonishment, the pediatric orthopedic surgeon recommended a Tommy-John-like procedure.
Ten years old, and he is facing some type of reattachment of the ulnar collateral ligament and an unknown future of the procedure.
How could this be happening? But it is, and it does all over the nation.
I will explain more in closing with recent scientific evidence that will scream at you that the current pitch count processes need to be tailored and individualized, as generalization in anything in baseball can lead to increased risks.
We must educate on this matter. Our players, parents, coaches, scouts, whomever involved in the player development process can take a generalized program and make their own with data-led throwing arm metrics.
WHAT WE KNOW ABOUT PITCH COUNTS AND INJURY PREDICTION
Early in my academic training, I teamed up with a couple of hyper-intelligent people who also have an active interest in baseball.
Shivam Bhan, who now works with Wilson, has a baseball pedigree playing for me when I was a grad assistant coach for the University at Buffalo.
He had a rubber arm, and from what I remember, he could bring it up to 94mph, but he was primarily a third baseman. He spent almost four months pitching 1000s of throws in the biomechanics lab at the University at Buffalo, where I was able to create my 3D digital model to reconstruct the pitching delivery and examine the effects of fatigue.
We eventually joined forces with Thomas Karakolis, a budding biomechanist himself with an active interest in inferential modeling to determine the risk of injury related to ergonomics aspects of the spine, which parlayed into baseball research to examine work-based data (pitches throwing, innings, etc.) Tom is now working in military defense.
After some discussion, we teamed up and put our efforts toward answering one key question—do pitch counts have any predictive merit in protecting pitchers from injuries in professional baseball?
Astonishingly, nothing was published, yet everyone in the world knows that the ominous 100-pitch limit is considered the holy grail of preventing injuries, and that cannot be further from the truth.
Key points from our research:
- Pitch counts, rest, innings, and relative metrics per inning do not predict injury, and in any year, an MLB pitcher has a 27% chance of throwing arm injury (ref)
- Inning restrictions for young players are meaningless as it relates to prevention of injury (ref)
WHAT WE KNOW ABOUT PITCH COUNTS AND VELOCITY RESPONSES
Another article we produced was on the piggyback system. In my first year with the St. Louis Cardinals, the team allowed me to publish de-identified data examining fastball trends in short-season baseball, as I wanted to know if fastball velocity could be a surrogate measure of fatigue and what could be detected when you share the load amongst two starters in a game and short inning reliever.
The piggyback system aims to reduce pitchers’ workloads early in their careers, when their bodies are still developing and coming from different places in the game, such as high school, junior college, free agency, and four-year institutions.
In a nutshell, the workload model was designed to develop starters and was unique at the time. What was very interesting to me was that no actual research was undertaken on this workload management strategy, and I think our group was the first and only to publish on it still to this day.
Key Findings:
- Pitchers predicted velocity increase was 4 mph throughout the season, with rest days having minimal influence on velocity changes, and that average velocity increased per outing (ref)
See the graphs below that indicate significant graphical trends.


To connect injury data to this work, it was next to impossible to obtain MLB injury data on minor leaguers. So, further work on the health aspect of this workload strategy was not understood until I joined forces with Jordan Oseguera of the Los Angeles Angels. He was the organization’s Pitching Analyst and is now our Director of Pitching Performance. He is a lead educator in our Bulletproof Arm Courses on pitching-related topics.
Like before, everything starts with a question. In this case, I asked Jordan point blank, “Are teams that have their pitchers throw less healthy?”
We took injury data for the minor leagues by level across 30 teams. We then put them in thirds. We eliminated the teams in the middle and compared data against the healthiest third and the most injured one in the league. The data was over a 7-year span. You would be surprised what we found.
Key Findings
- Pitching less at short-season levels leads to greater injuries
- Pitching less at full-season levels leads to greater injuries
- Pitching less at AA/AAA levels leads to greater injuries
So we were mind-boggled. The biggest cause of pitching injuries is PITCHING. How could throwing more reduce the risk of injury?
The OPTIMIZATION concept was staring us in the face, and underloading the arm appears to be a larger physiological problem than throwing more. We had already researched pitch counts at the MLB level. Throwing didn’t matter, but in development, our unpublished work definitely does.
The typical workload in pro ball follows a staircase, and it doesn’t make physiologic sense as it goes by month, a time point in the season, and then the competitive level.
There is nothing magical. Pitchers in full seasons start with 4 innings and 60 pitches, then progress to 5 innings and 75 pitches, then 6 innings and 90 pitches, and generally, no team allows their pitchers to reach 100 pitches, as going over that maximum sends the coach and coordinator to the gallows. There is a stat called pitcher abuse points, which we confirmed by research cannot predict abuse.
However, it is pretty interesting how the number 100 is the maximum limit for professionals, and it is really unbelievable that pitchers build all that capacity up in high school or college and then follow 15-year-old pitch-smart standards upon being signed.
The question remains: If kids are throwing more before the pro ball, then their workload is dramatically reduced in a short season and then boosted over 10% of their typical workload either in the same season or the following season.
Are we uncovering a multi-level problem?
Plain and simple, YES! There is a problem, and we need to be led by the throwing arm, not some assumed mathematical workload model that doesn’t account for pure chaos in season and injury histories.
WELCOME TO THE ERA OF INDIVIDUALIZED PITCH COUNTS
Recap of things you may still doing despite the research indicating they don’t work:
- Providing the same daily limits for everyone on the team regardless of injuries
- Assuming that a 5 or 6 day rotation provides adequate recovery for all players
- Assuming that a bullpen placed on Day 2 or Day 3 doesn’t matter
- Building up pitchers in a staircase fashion (more innings, more pitches with time)
- Assuming that 0 days rest from current guidelines doesn’t fatigue the arm the following day and can do that consecutively until a daily max is reached
- Assuming it is okay to pitch the same pitcher in both games of a doubleheader
ArmCare.com has been and will continue to challenge the status quo. The company is now the world leader in throwing arm monitoring and performance at an unprecedented level (reaching 40,000 athletes).
It owns the largest database of throwing arm strength metrics in the history of the sport.
It is with every single MLB team at the player or organizational level, as well as with many colleges, travel teams, and international destinations.
It has 10 courses and 33 hours of education on eradicating injury risk and dominating performance, as well as 2 certifications that have the approval of allied health accreditation boards for athletic trainers, physical therapists, strength coaches, and upskill coaches who do not have an anatomical background at an accelerated rate.
That said, the company’s greatest innovation is its revolutionary individualized pitch count tracking feature, which will be officially released tomorrow.
HOW IT WORKS
- Pitch Smart Guidelines. Most teams, leagues, and tournaments in baseball follow Pitch Smart Guidelines that have been developed by very smart people in our sport across sports medicine and sports sciences related to injury. This template is the starting point with suggested adjustments at the beginning of seasons, and the app does the wave loading for us – you pitch more when you are strong, you pullback when you are fatigued, and additional metrics relate to shoulder balance and recovery further refine our algorithmic approach to pitch count individualization. We give you an exact number based on your throwing arm function.
- Injury History. Athletes will indicate their injury history in the app. The pitch count intelligence tightens windows, creates greater safety around existing data, and delivers the best processes for re-entering pitchers after being rehabilitated and preventing future injuries among athletes who have had injuries in the past.
- Athlete Responses. Athletes answer questions to trigger our pitch count intelligence. Questions like:
- How does their body feel?
- How does their arm feel?
- When do they pitch next?
- When did they pitch last?
- If they have thrown a bullpen?
- Plus, additional context outside of throwing arm strength metrics that weigh the pitch count result to scale it even further.
- The Key Metrics. Hopefully, if you have been reading our newsletters, taken our courses, or have used the app, you will have familiarity with the metrics integrated into individualizing pitch counts.
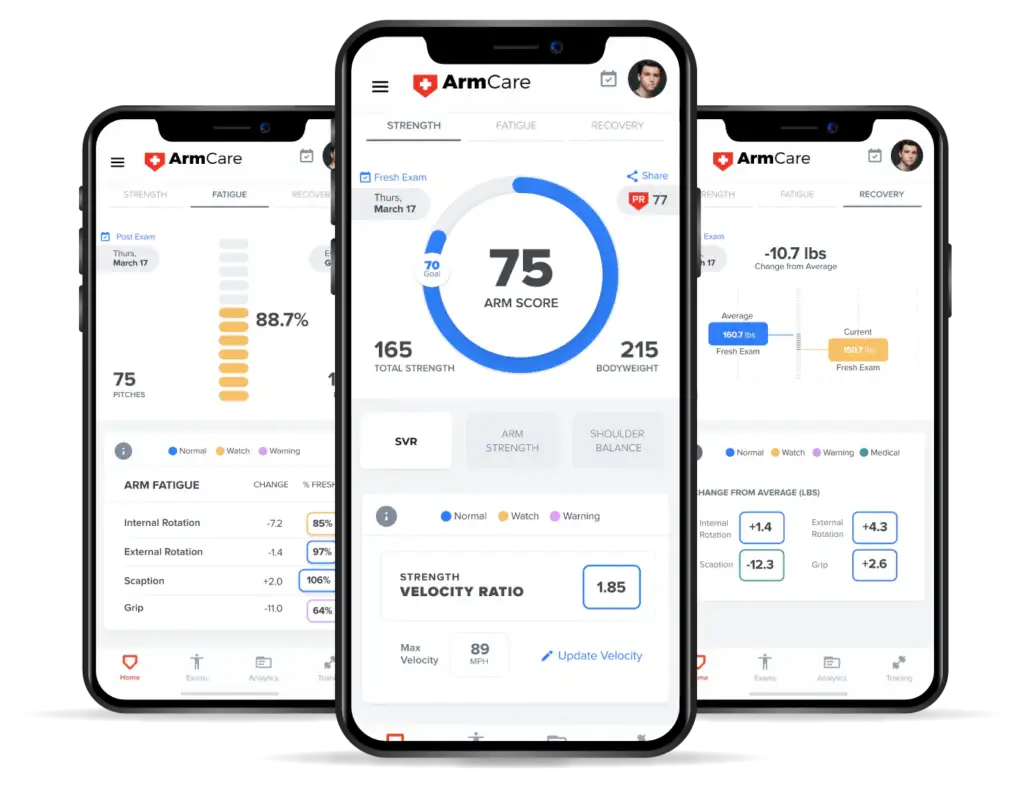
- ArmScore – this is the athlete’s throwing arm strength to body weight ratio
- Strength-Velocity Ratio – this is the athlete’s arm strength relative to fastball velo
- Fatigue Score – This is the percentage of strength retained after pitching or high intensity throwing bouts
- Recovery Score – This is the measure to indicate how the arm bounces back
- Shoulder Balance – This is the measure to indicate if muscles are fighting each other
BRINGING IT FULL CIRCLE
As I have been helping this young prospect, I have been researching pitch counts and what they do to the throwing arm. Many studies (peruse a few here – ref1, ref2, ref3, ref4) report that the throwing arm weakens, and the joint gap opens, indicating a loss in medial elbow stability in bullpens, no batters, no adrenaline, limited biomechanical compensation with a more repeatable delivery as the radar gun isn’t in their face. What do you think happens in actual games? What does losing strength and medial elbow stability look like when we hit a daily max without preparing the throwing arm?
This study was just released last week, and it couldn’t be more timely for our launch and to give my young athlete the understanding that it may not have been his arm, but rather he was put into a generalized system without any monitoring.
Key Findings
- The daily pitch count for 10-year-olds reduces forearm strength, which chronically could impact a loss of stability.
- The daily limit can be potentially dangerous for this age group as the forearm muscles have less fuel. Intramuscular carbohydrates, a key fuel source for working forearm muscles, indicate depletion in just a few games.

THE TAKE-HOME MESSAGE
Our pitchers of all ages are competing and flying blind. We are throwing athletes back-to-back and putting relievers out on short rest, even after throwing a bullpen in between two appearances, which is like going back-to-back-to-back.
They are pitching more when they are not strong enough to handle it and should be lowering their pitching counts. They are pitching less when they are strong enough to handle it and should pitching more. We are blaming all sorts of things on injuries and not talking about the throwing arm’s function.
We are part of the problem as it’s taken a while to get to this point, but we now offer the best solution to significantly reduce the national average for surgical cases, which is 5 in every 100 pitchers.
Injuries have cost the nation over $3 billion in medical bills each year without involving MLB talent, which could bring that number closer to 4 billion.
Compared to the projected annual medical financial burden each year, the money spent on surgeries and rehabilitation could afford an ArmCare sensor and premium account for just about every athlete to ever pick up a baseball.
My athlete, a brave 10-year-old boy, is not pitching at the moment, but I can assure you one thing: he will rise again, and his story hopefully resonates with you.
Every breakdown is a breakthrough, and this young man is going to understand his arm better than anyone in the world and create a path of optimization for himself, communicating with his coaches along the way.
I also need to tell you that MLB surgeons in my network are truly heroes of mine. Three of the biggest surgeons in the game reviewed my athlete’s MRIs and X-rays, and the consensus was not to put this young boy under anesthetic and operate on his elbow as the risks were too high.
It was an immense relief to me because their recommendation aligned with my thoughts—STRENGTH MATTERS MOST, and it’s time to get after it.
Generalization = Hospitalization. Individualization = Optimization
You have a calculated choice to make. Will you keep your pitch count strategies the same and experience pain, or go against the grain and win the game?
For more information on our individualized pitch count technology, go here to sign up to receive a copy of our Pitch Strong Guidelines and be ahead of the curve.
Ryan
Ryan@armcare.com
