Strength in Numbers #165
The past three days were a whirlwind. We educated coaches on various techniques, applied understanding and decision-making to their processes, and worked with all 56 players on the roster.
We filmed nearly 60 training exercises and drills for their pitching and strength coaches, connected dots for their medical staff, and brought everyone together.
Northeastern Junior College’s baseball team was searching for higher learning and deeper insights from the ArmCare platform and to lean on the coaching experience that Jordan Oseguera and I have been blessed to have across all levels of competitive baseball.
The onsite offering we provided through the ArmCare Accelerator was 25 hours, including four additional remote meetings, and everything was customized.
Head Coach Andrew Katchel simply wanted us to attack their approaches from every angle and help them achieve even more success.
More to come on that end, where we will give you an inside look at the action.

DEDICATE YOURSELF TO LEARNING TIME
The design of the customized itinerary for the Accelerator education, the theoretical portion, applied database mining, data-led training sections, the discovery calls, the internal meetings, the products delivered, and the preparation beforehand all take hours for each team we serve.
On the flight home, I realized how much we have been educating over the past three years but how little time I have personally been putting forth to educate myself.
If you do not have questions, you cannot seek answers, and for a long time, I have had questions that I have yet to dedicate time to search and destroy, at least until now.
The kind of research I do now is focused on the life and death of the throwing arm—Tommy John Surgery risk detection and prevention, and the blend of strength and coordination, applying throwing arm strength principles to biomechanical movement preferences.
A LITTLE TASTE OF WHAT I AM RESEARCHING NOW
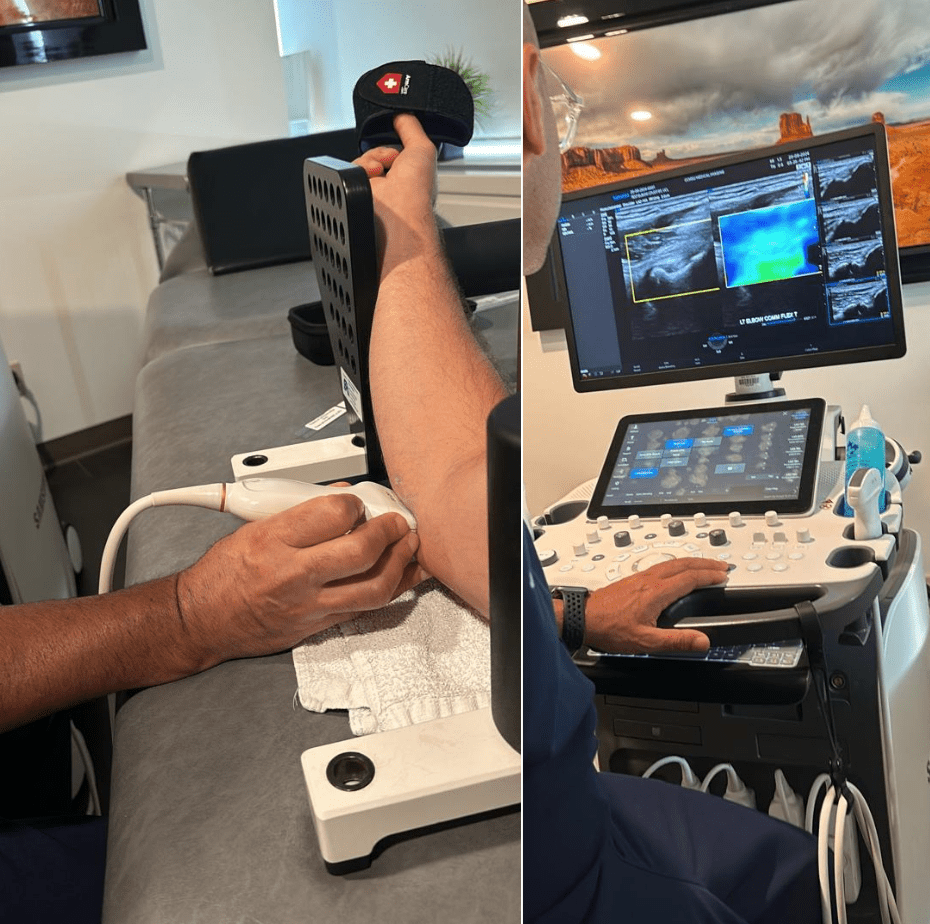
I feel that I have a pretty solid grasp of biomechanics. Looking at arm strength data since 2010, I am starting to intersect the two, but now I am bringing ultrasound scanning to the fold. I think the intersection of strength, load, and tissue response will give extensive insights into injury detection and durability.
Ultrasound research is challenging and requires integrated investigators, such as ultrasound technicians, radiologists, and other specialists who are well-versed in studying tissue data.
The biggest areas of focus are:
- Tissue stiffness (m/sec)
- Joint Gapping for the medial elbow with stress testing (mm)
- Appearance (calcifications, tendinopathies, microdamage, etc.)
We are putting pieces together while integrating our testing approach for the flexor digitorum superficialis so that we can bust open the training rules to prevent the ligament from busting apart.
Treat the throwing arm like porcelain, and it will break. Still, you have to do things intelligently as GENERALIZATION = HOSPITALIZATION, and therefore, we need to shift our attention to INDIVIDUALIZATION = OPTIMIZATION as a mathematical expression.
SOME KEY STUDIES AND INFORMATION TO CONSIDER IN THROWING ARM MONITORING
I have been very interested in coaching approaches and their effect on arm strength. We have our process of attacking mechanical changes, but there is still more to be done uniting throwing arm strength research to biomechanics.
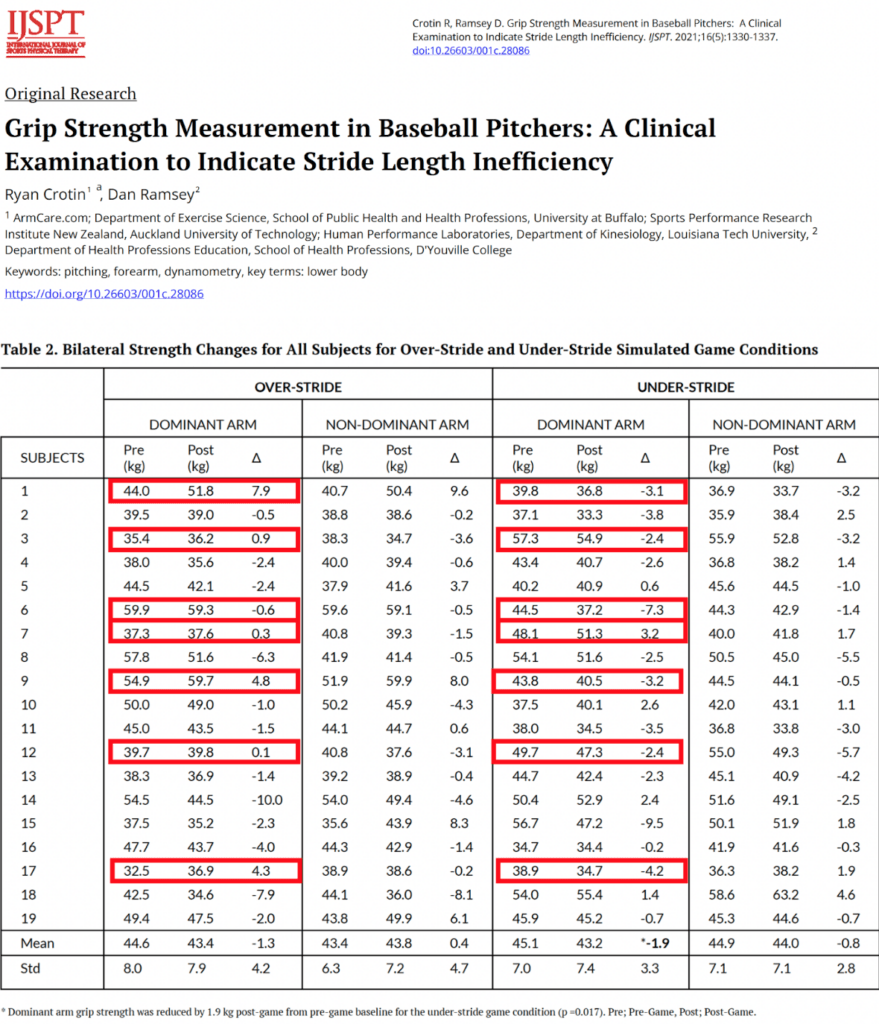
I reviewed some data in a research article I published with my PhD Chair, Dr. Dan Ramsey, a while ago on how grip strength is affected by changes in ground reaction force caused by altering a pitcher’s lower body movement.
TYING IN AN EVIDENCE-BASED PRACTICE AND PRACTICE-BASED EVIDENCE APPROACH TO PREVENT DEATH BY THE CURE
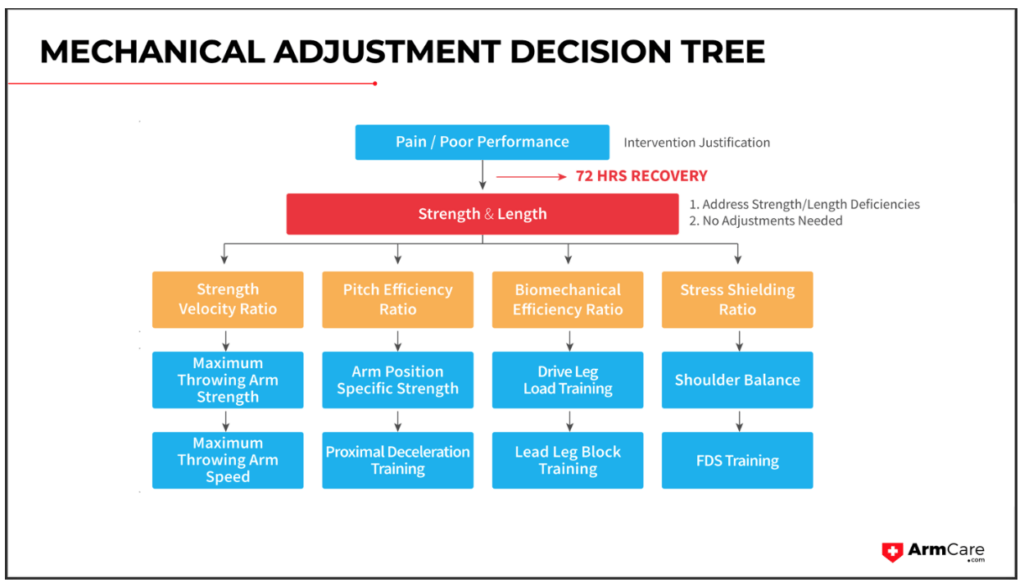
A really important concept is the Strength and Coordination Decision Tree from the Certified ArmCare Specialist Course.
We discuss in depth when to make a mechanical change, how to stabilize changes in mechanics, and how to evaluate them for performance and health.
“Death by the Cure” is a front office expression for when they are ready to cut bait with pitching coaches and coordinators who suggest a mechanical change in a pitcher that leads to their demise.
This presents a sticky situation between private facilities, colleges, and MLB teams, who often quarrel about which one of the three messed up their pitcher. Bottom line – if the door ain’t broken, don’t fix it, but maintain it.
On the flip side, if the athlete has either pain or poor performance, fix the throwing arm first upon making a biomechanical change. When ready, in the pitcher’s first mechanics-focused bullpen session, evaluate the amount of fatigue the pitcher experiences in their throwing arm to determine if the mechanical change needs a slower build-up to prevent fatigue-induced injury.
Think about it, you teach pitchers a split finger and then ask them to throw it 15% from 0% – that’s a disaster waiting to happen.
MORE THUNDER BRINGS RAIN
The relationship between velocity and torque is still unclear, but one thing that has shown up hot off the press is that pinch grip reduces in pitchers who throw with higher torques, a biomechanical quality that is characteristic of high-velocity pitchers and when the same pitcher increases the intensity of their throws.
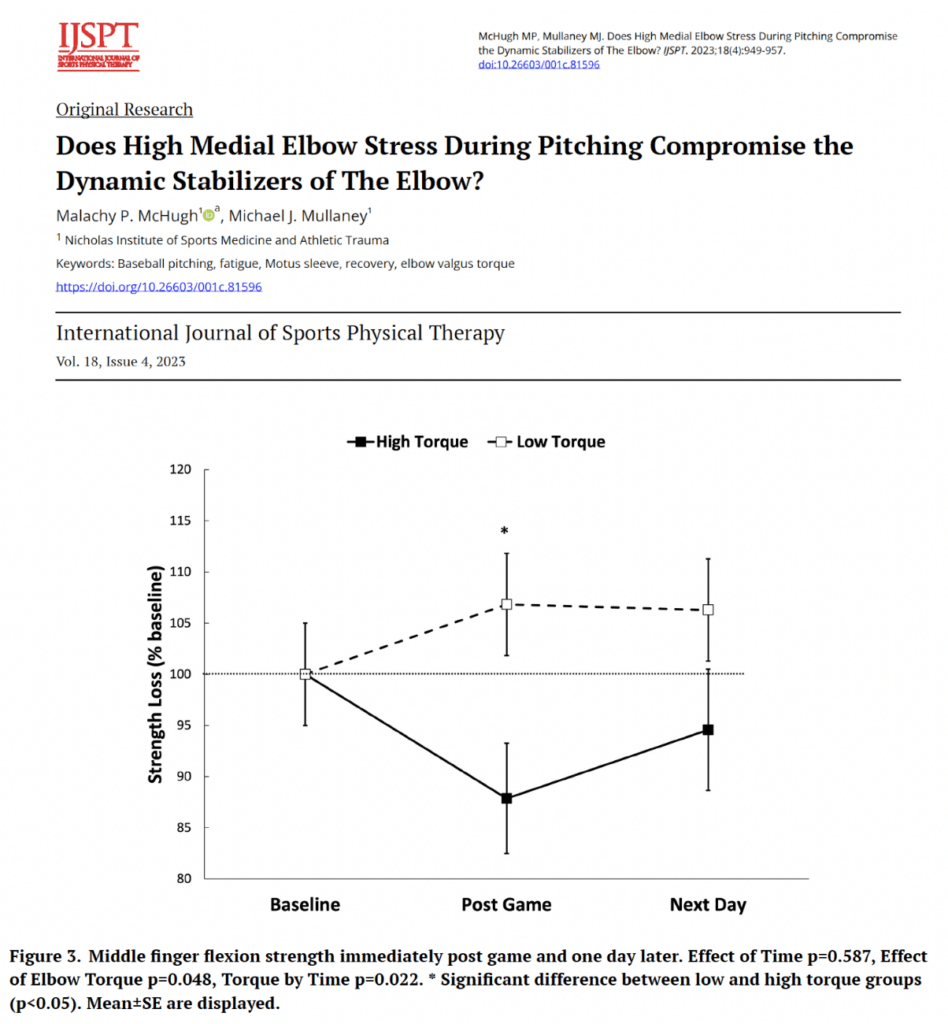
Looking at the pinch grip graph, we cannot assume that our athletes are responding well to workloads. Most importantly, if your athletes are increasing velocity, put them in a tight monitoring bucket.
They are exposed to the potential of greater elbow torque and greater muscular fatigue in the flexor-pronator mass of the forearm. As a simple rule, when a player comes back to you from time off and demonstrates greater velocities beyond a 2 mph average, the approach should be keeping their throwing workloads low the following day after pitching and monitoring consistently.
A NON-SIGNIFICANT AND SCARY SITUATION
Throughout my years in MLB, I have come to find that 53% of pitchers are stronger in their non-throwing arms than in their throwing arms (Yikes!). Somewhere along the way, fatigue had set in either peripherally (arm level) or central nervous system (brain level), or that microdamage impeded force production or rather the destruction of blood supply with shattered capillaries that can occur with all out maximum throwing.
Whichever the case, it’s not a good situation, and I came across an old study that had an alarming finding that is of the same observation – throwing arms that are not stronger than non-throwing arms and increased external rotation strength as players age (and likely throw harder)
This research article screams that we must push the envelope. If we want the throwing arm to throw fuel, we need to feed it intense training, manage throwing programming, and systematically progress competitive play and weighted ball use with a data-led approach. Be an expert with the ArmCare.com platform and education, and you will learn how your players can fight fire with fire.
No question it’s time to light a match under your player’s backsides and get them thinking about how much arm strength they need to gain this offseason, especially if they are a teen. Outgrowing your arm strength or playing for the tie, which I have shown above, doesn’t get it done. ArmScores must go up as the player ages, plain and simple.
Okay—you have read quite enough of some key bits of research I have combed through. I am putting on my reading glasses and will deliver more interesting findings in the coming weeks. I will also give you a deeper inside look at a unique ArmCare Accelerator event where we blended art, science, learning, and fun—the ultimate baseball all in one.
Have a great weekend all.
STRENGTH MATTERS MOST.
Ryan
Ryan@armcare.com