Strength in Numbers – 271
Baseball can measure velocity down to the decimal point.
But for years, we had a much harder time answering another question:
How much strength, and what kind of strength, do athletes need to support their velocities?
That question helped drive the development of the metrics we use today: ArmScore, Shoulder Balance, and Strength-Velocity Ratio (SVR).
Start With Four Strength Tests
The foundation is objective dynamometry of the throwing arm.
ArmCare monitors four primary strength measures:
Internal Rotation + External Rotation + Scaption + Grip
In MLB, we used very sophisticated equipment to test these positions and evaluated pinch and grip, but with ArmCare it’s now wearable and can detect them with high accuracy.
Those individual measurements matter because a total strength number can hide a weakness. A pitcher might have considerable overall strength but still have an external-rotation, scaption, or grip deficit. We need to understand each muscle that supports the shoulder and elbow.
Once we measure those forces, however, we can start creating relationships that are much easier to interpret.
ArmScore: Strength Relative to Body Size
Absolute strength doesn’t tell the entire story.
Imagine two pitchers each produce 180 pounds of total throwing-arm strength.
Pitcher A weighs 180 pounds.
Pitcher B weighs 225 pounds.
They have the same absolute strength, but not the same relative strength.
ArmScore expresses total throwing-arm strength relative to body weight. ArmCare describes it as the throwing-arm strength-to-bodyweight relationship.
The mass is simplified, but important to understand. A score of 70 is associated with less inflammation and fewer treatment needs for the throwing arm; try to keep boosting this number, as it is our minimum standard.
ArmScore = Total Arm Strength ÷ Bodyweight × 100
For our 180-pound pitcher:
180 ÷ 180 × 100 = 100 ArmScore
His total throwing-arm strength equals 100% of his bodyweight.
For the 225-pound pitcher:
180 ÷ 225 × 100 = 80 ArmScore
Same arm strength, but different athlete and different capacity relative to his size.
This becomes particularly important as young athletes grow. Adding 20 pounds while maintaining the same throwing-arm strength actually lowers relative strength.
Getting bigger doesn’t automatically mean the throwing arm got stronger with you.
The current Velocity Checklist uses an ArmScore of 100 as one benchmark.
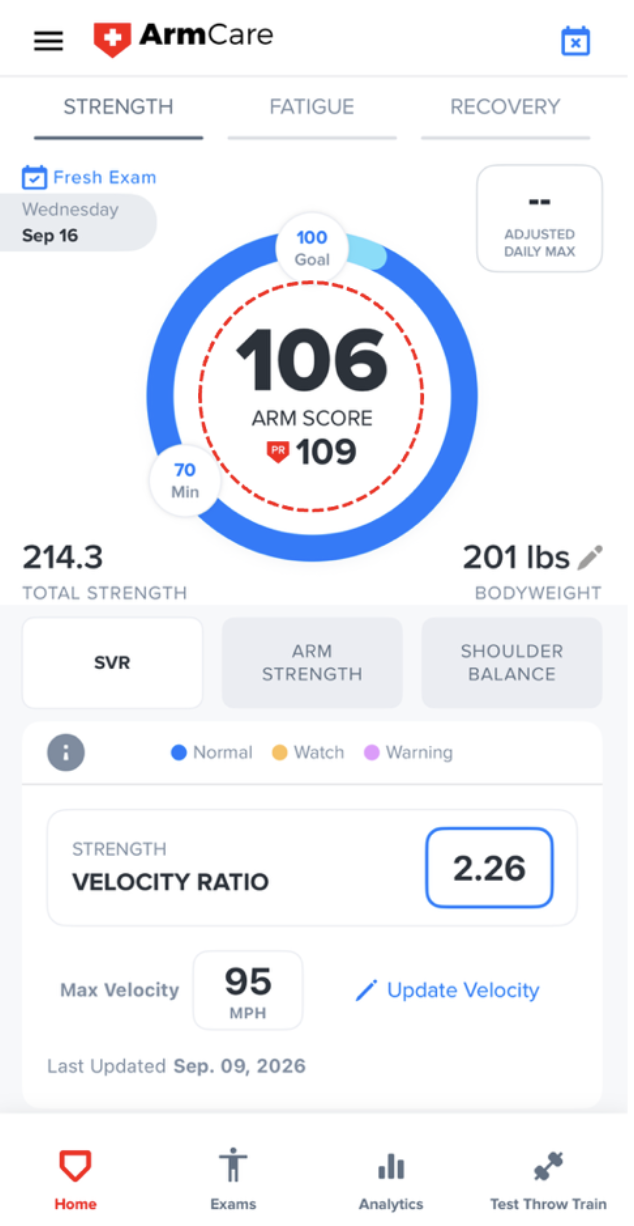
Circled in red is the ArmScore. It is calculated by dividing the athlete’s total arm strength by the athlete’s body weight.
Shoulder Balance: Accelerator vs. Decelerator
Next comes the relationship between external- and internal-rotation strength.
The calculation is straightforward:
Shoulder Balance = ER Strength ÷ IR Strength
Suppose a pitcher produces:
Internal Rotation = 40 lb
External Rotation = 36 lb
Then:
36 ÷ 40 = 0.90
That athlete has an ER: IR ratio of 0.90, meaning ER strength is about 90% of IR strength.
Now imagine his IR strength climbs to 45 pounds while ER remains at 30:
30 ÷ 45 = 0.67
His shoulder became stronger in one direction, but less balanced as a system.
That’s an important player-development lesson. Among professional pitchers who were pushed to test velocity enhancement, if they were unable to stay in the 0.85-1.05 range, their risk of surgery went up dramatically.
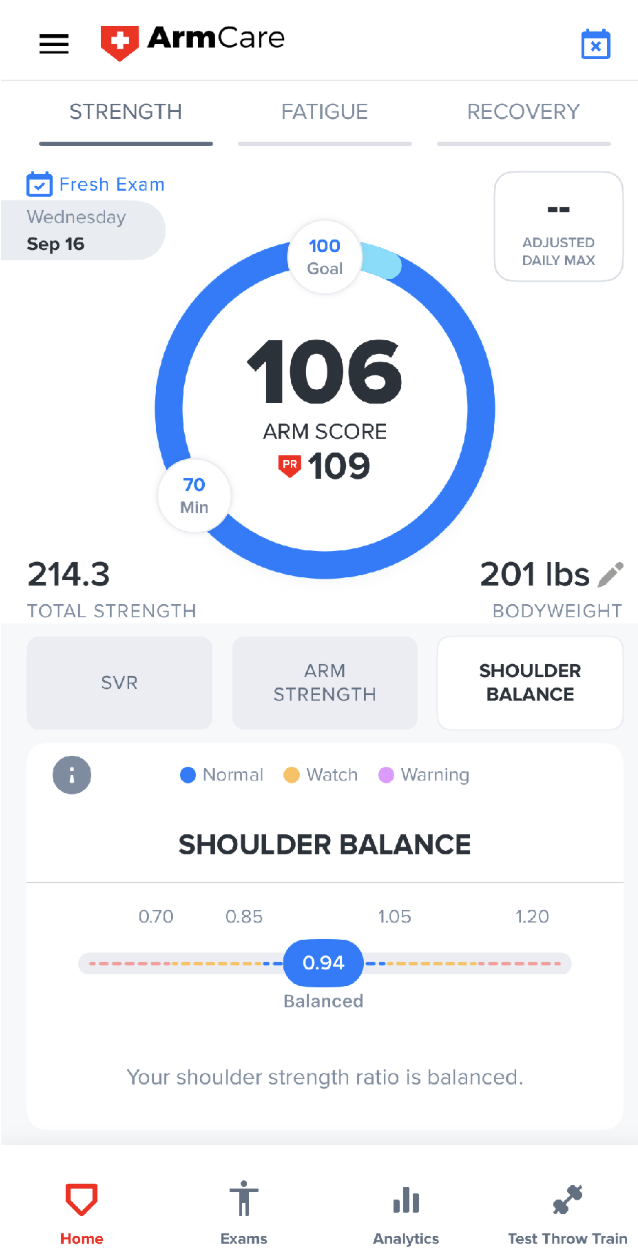
We want the slider to be all blue for Shoulder Balance. Note that this athlete is at 0.94 that is only 6% away from being completely balanced on both sides of the shoulder.
SVR: Strength Relative to Speed
Now we connect strength to what everyone in baseball already measures…Velocity.
Strength to Velocity Ratio (SVR) is calculated as:
SVR = Total Throwing-Arm Strength ÷ Maximum Throwing Velocity
This gives us pounds of arm strength per mile per hour of throwing velocity.
That’s also how the current ArmCare material defines the calculation. Looking at professional players, if you are under 1.6, you may be relying too much on elasticity rather than force production. In a more hypermobile group of athletes, like high school athletes, that could be a problem.
Take two 90-mph pitchers.
PITCHER A
180 lb total arm strength ÷ 90 mph
SVR = 2.0 lb/mph
PITCHER B
135 lb total arm strength ÷ 90 mph
SVR = 1.5 lb/mph
The radar gun sees the same thing: 90 MPH.
The strength assessment sees two very different athletes.
That’s why SVR exists.
It gives velocity a capacity denominator.
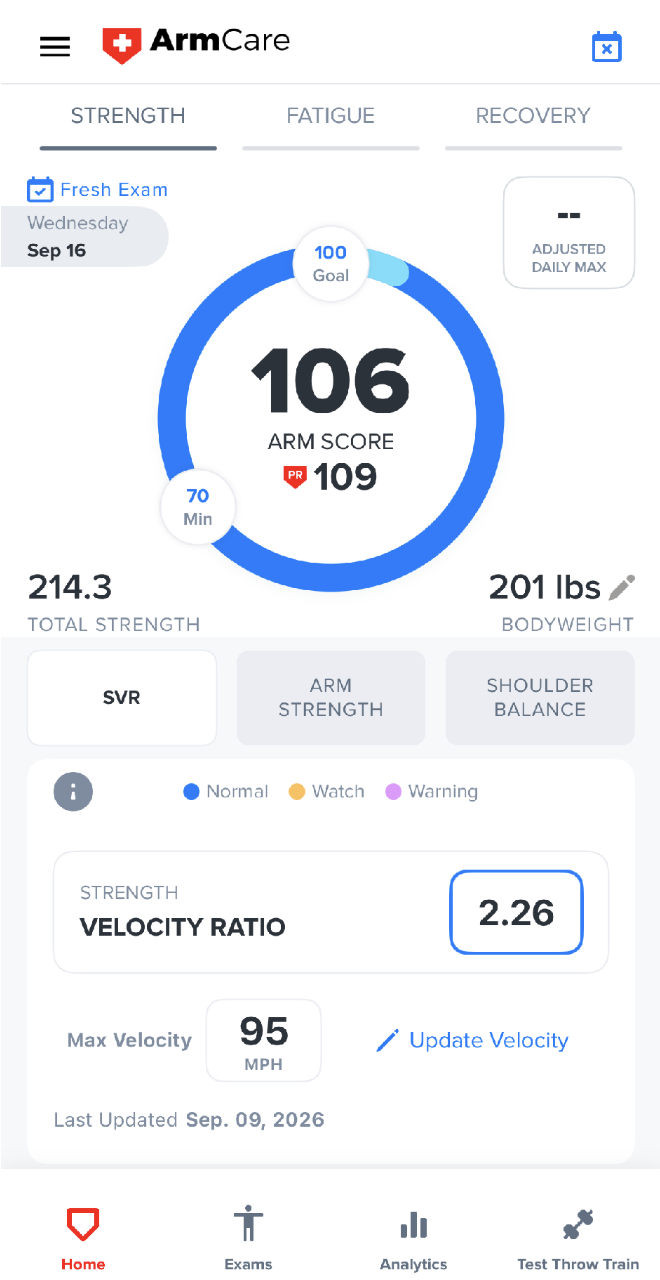
This athlete has an SVR of 2.26. This is a high strength-to-velocity ratio. Aim for more than 2.0 for your SVR to demonstrate greater force contribution to fastball velocity.
See Where You Stack Up
A 1.6 SVR means something different for a 12-year-old than for a 20-year-old.
That’s why the normative tables in the Return Beyond Performance Guide rank SVR by age at the 25th, 50th, 75th, and 90th percentiles.
For example:
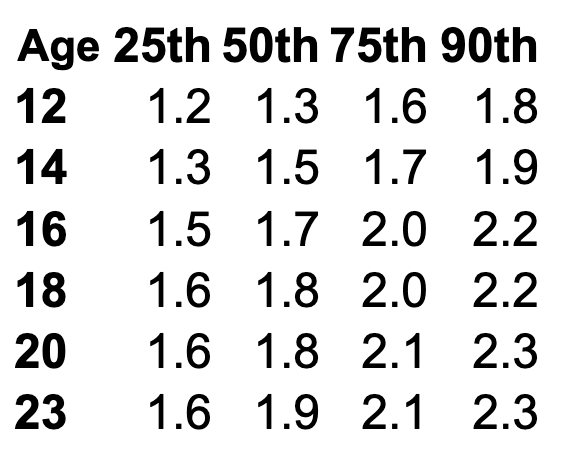
Once you test your throwing arm, see where you land on the table. The highest bracket for throwing-arm surgeries is high school athletes, and, unsurprisingly, 1.6 doesn’t show up for most players until age 18.
Takehome Message
Velocity isn’t the enemy.
Unprepared velocity is the concern.
Instead of looking at a radar gun and saying:
“He throws too hard.”
We can ask:
How strong is he for his bodyweight?
How balanced is his shoulder?
How much arm strength does he possess for every mph he throws?
Are those relationships improving as his velocity increases?
Baseball doesn’t need to stop measuring velocity when our athletes can test their throwing arms and understand if they are strong enough to handle the load.
Strength Matters Most.
Ryan
Ryan@armcare.com